When it comes to understanding and managing your health, it’s crucial to track certain biomarkers that give you insights into your overall well-being.
One of my main goals as a healthcare provider is to help my patients make sure their Lifespan matches their Healthspan.
Lifespan: This is defined as the time you have on earth from your birth to your death (sorry, that may have gotten dark...)
Healthspan: This refers to the length of time a person lives in good health, free from serious disease or chronic conditions that limit functional capacity or quality of life. Healthspan focuses on the years during which a person remains physically active, mentally sharp, and relatively free from disease or disability.
At any stage and at any point, people have a lot of opportunities to become healthier.
Three of the most important indicators we watch with our patients are their Body Fat Percentage, Sleep Quality, and VO2 Max. These metrics are not just numbers; they are windows into your cardiovascular health, metabolic efficiency, and overall longevity. Below, we’ll dive into why each of these biomarkers matters and how you can use them to improve your health. My 3 favorite tools for tracking are with a Garmin Wearable, a STYKU 3D body comp, at home Biometric Scale, and of course meeting with me face to face to review baseline, establish goals to improve baselines. Ooo, and I do love some good yearly labs to check on your thyroid, adrenals, liver, kidneys, vitamins and more. BUT, these metrics are fun to watch on your own!
- Body Fat Percentage: The Silent Indicator of Health
Body fat percentage is one of the most important yet often overlooked indicators of health. Unlike Body Mass Index (BMI), which only considers weight and height, body fat percentage gives you a clear picture of how much of your body is made up of fat compared to lean mass (muscles, bones, organs). If we just look at the scale, it's just 1 number, it does not tell us how healthy and strong we are... or, if we have excessive fat we should convert to muscle. Oftentimes we can have what some people unaffectionately call the "skinny fat". These are people we are all silently jealous of...they "look skinny" or healthy but actually have very little skeletal muscle mass, and even though they appear to the naked eye as healthy, or have a normal or "healthy" BMI. In reality, they really are sitting at a far greater metabolic risk. We have many patients that have a higher BMI, or look big boned, but have much more skeletal muscle mass and are in much better metabolic shape. Knowing how much skeletal muscle mass you have compared to body fat is a much better tool than BMI.
Optimal Body Fat Percentages by Age and Gender
- Men:
- Teens (under 18): 12-18%
- Ages 20-30: 8-15%
- Ages 30-39: 11-17%
- Ages 40-49: 12-19%
- Ages 50-59: 13-21%
- Ages 60+: 14-24%
- Women:
- Teens (under 18): 16-23%
- Ages 20-30: 18-24%
- Ages 30-39: 19-25%
- Ages 40-49: 20-27%
- Ages 50-59: 21-29%
- Ages 60+: 22-31%
Maintaining a healthy body fat percentage is crucial because excess body fat is associated with an increased risk of cardiovascular disease, type II diabetes, certain types of cancer, as well as hormone excess (too much estrogen's and cortisol). On the flip side, too little body fat can lead to hormonal deficiencies, weakened immunity, and reduced bone density. This month, Back in Line is now offering the STYKU, a 3D body composition measurement (Sample Report). You can do a stand alone single test to get a baseline, or get a 2 pack and kick off your "get healthy" goals for pre and post measurements. I know with football season and fall food in full swing it can lead to unhealthy habits. We can tailspin by starting off at tailgates, then onto the Halloween candy, then to Thanksgiving and Christmas... help hold yourself accountable today. The 3D body comp is an excellent tool to understand how much muscle mass you have compared to fat mass. Oftentimes I will see patients truly clean up their diets and not see the scale change. However, they may not realize the INCHES LOST and the MUSCLE GAINED if the scale only changes by 2 lbs. By being able to track how individuals are body recomping (converting fat to muscle), it helps one gain a clearer understanding of how their health is improving. (did you see that sample report? A patient lost "only 2 lbs" but a total of 14 inches over a 6 week period!!) I am excited about utilizing the STYKU because you can see over a 4-6 week period just how much healthier and metabolically stable you are, you can visually see and track the INCHES lost which helps keep you excited and motivated to fulfill your health and weight loss, strength gain goals!
2. Sleep Quality: The Foundation of Longevity
We all know that sleep is important, but sleep quality is the real game-changer when it comes to health. It’s not just about getting 7-8 hours of sleep per night, but also about the quality of that sleep. To optimize your sleep, aim for:
- 7-8 hours of total sleep
- At least 60 minutes in deep sleep
- At least 60 minutes in REM sleep
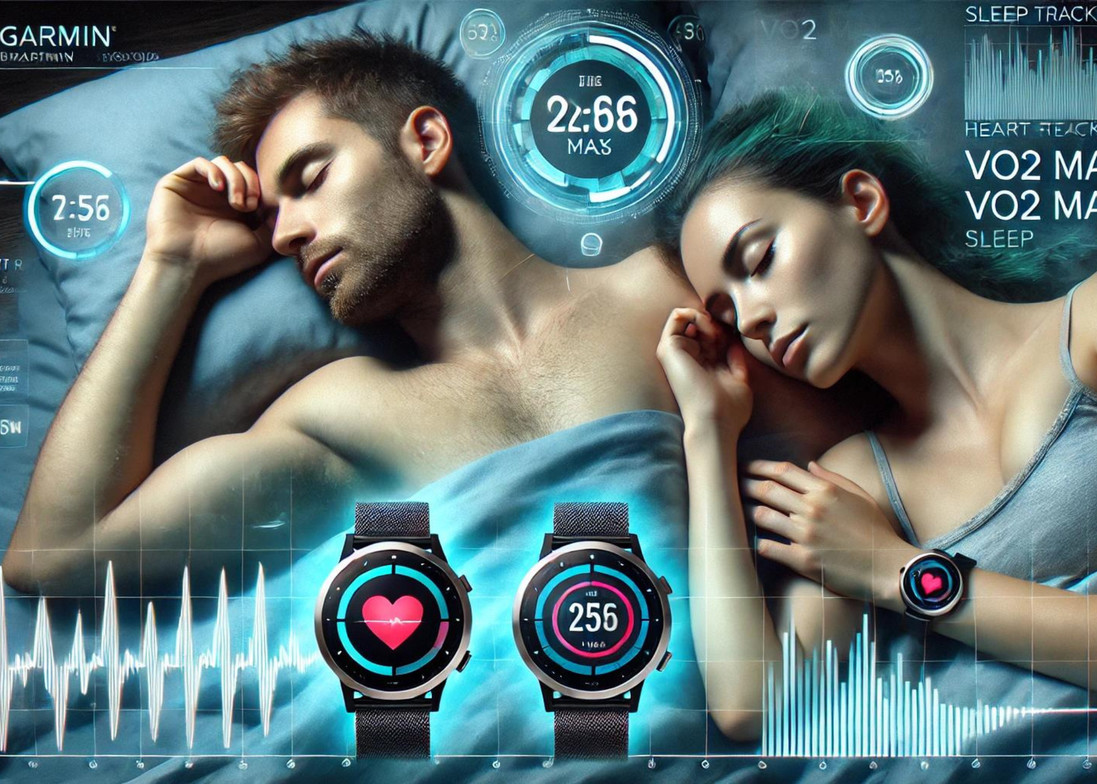
Using a tool like a Garmin Watch can help you track these metrics and ensure you’re hitting your sleep goals. Poor sleep quality, characterized by insufficient DEEP or REM sleep, has been linked to increased risks of heart disease, obesity, and cognitive decline including early onset dementia and Alzheimer's.
Special Considerations:
- Snoring: If you snore, you might have undiagnosed sleep apnea, a condition that disrupts your sleep and puts you at risk for various health issues, including hypertension and stroke.
- Mouth Breathing: Sleeping with your mouth open could indicate lower oxygen intake, which accelerates brain aging
Taking your sleep seriously is a key player in your overall health and longevity. If you're in the market for a Garmin device to help track your sleep, be sure to email our front desk. We offer our patients a special promo code for 20% off! If you are a patient of the clinics, please confirm with me which model you plan on investing in so I can make sure it includes all of the best SPECS for tracking all things health & wellness. Keep in mind, in the patients I work with, some have found they drop 20% O2 while they sleep. In that case we consider the patient likely has undiagnosed Sleep Apena, or obstructive airway issues, or even simply improper breathing while sleeping and work to correct that metric. If your O2 drops that much while you sleep, you are accelerating cognitive decline, alzeheimers and dementia. Additionally, I've seen teenagers that sleep hard for over 9-10 hours and not have more than 20 min in DEEP and REM. The good news is that KNOWING these data metrics allows us more targeted, specific interventions and delivering a more individualized care plan.
3. VO2 Max: Not just for athletic performance.
Most of the time, you'll hear endurance athletes talk about understanding their VO2 max for understanding what their body needs for dietary intake during their 100 mile bike day, or 50 mile ultramarathon. But VO2 max is a big tool I use with my patients desiring a high quality of life, especially as they approach their retirement years.
I understand that not everyone aims to be a superhuman athlete, but I want my patients to be metabolically fit enough to handle life’s challenges—whether that’s recovering from a car accident, battling cancer, or bouncing back after a hip replacement. Your VO₂ max, measures your body’s ability to use oxygen, plays a key role in your resilience. A low VO₂ max is linked to lower survival rates in these situations, while a higher VO₂ max improves your chances of thriving and overcoming various health challenges.
VO₂ Max Ranges by Age and Gender (mL/kg/min):
MEN
|
Age |
Poor |
Fair |
Average |
Good |
Optimal |
|
20-29 |
< 33 |
33-38 |
39-43 |
44-50 |
> 50 |
|
30-39 |
< 31 |
31-35 |
36-40 |
41-45 |
> 45 |
|
40-49 |
< 29 |
29-34 |
35-39 |
40-45 |
> 45 |
|
50-59 |
< 26 |
26-30 |
31-35 |
36-41 |
> 41 |
|
60 |
< 20 |
20-25 |
26-30 |
31-35 |
> 35 |
Women
|
Age |
Poor |
Fair |
Average |
Good |
Optimal |
|
20-29 |
< 23 |
23-28 |
29-33 |
34-40 |
> 40 |
|
30-39 |
< 21 |
21-26 |
27-31 |
32-38 |
> 38 |
|
40-49 |
< 19 |
19-23 |
24-28 |
29-34 |
> 34 |
|
50-59 |
< 17 |
17-21 |
22-26 |
27-32 |
> 32 |
|
60 |
< 16 |
16-19 |
20-23 |
24-30 |
> 30 |
If you are a patient of our cliniccs and want to invest in a Garmin Watch, email frontdesk@mybackinline.com with the subject GARMIN DISCOUNT.
My favorite watches that have the spec's I like most:
- Garmin vívoactive® 5 | Fitness Smartwatch with GPS << basic but covers soooo much data points and my main tracking specs
- Garmin Venu® 3 | Fitness and Health Smartwatch << this is the most comparable to the Apple Watch, but IMO, 1000x better ;) and with a much longer battery life. Garmin Forerunner® 265 | Running Watch
- fēnix® 7X Pro – Solar Edition (No Wi-Fi®) | Multisport Smartwatch (garmin.com) - 28 day battery life!! even longer with solar!
*not all Garmin's track and have all of the specs we encourage people to track and monitor.
If you want to dive all-in for your health, consider doing a Cardiovascular Preventative Risk Assessment with Jill Reese, PA-C, or schedule a functional medicine consultation with me! Book online or by calling the Front Desk today 319-892-3363.


